 xbymc
xbymcHi everyone! Today I’m kicking off a new series about RO membrane troubleshooting, and I’m calling it: “Why Did You Change?”.
Ever had your RO membrane suddenly start acting up? Like, either the water production just isn’t cutting it anymore, or the salt rejection is dropping like a rock? That’s exactly what we’re talking about here. The point of these cases is to give you some real-world ideas when you hit a snag. Problems happen, but as long as you’ve got a solution, you’re golden.
Let’s start with a project we dealt with last month. This one was at a coal chemical plant in Shanxi, China. They bought 30 pieces of our anti-fouling membranes back in September last year. Then in May this year, they hit the panic button: “You guys need to get here fast! The system’s salt rejection just dropped to 94%!”
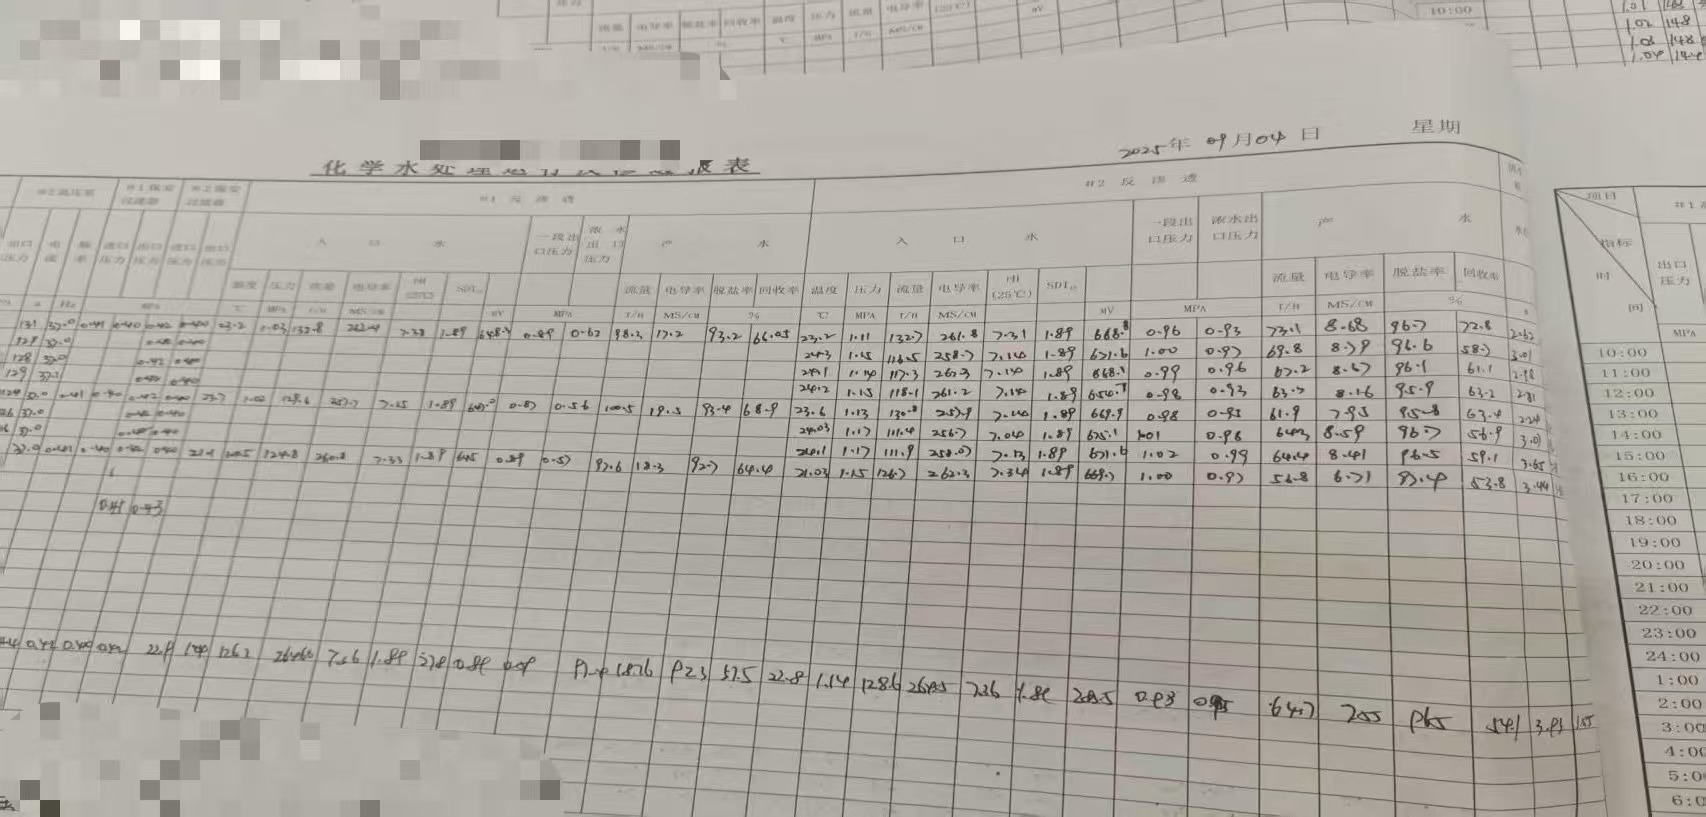
For this system, the water production rate was still fine—no major changes there. The main issue was the salt rejection. When the membranes were first installed, it was sitting at a solid 98.5%. When our tech team got on-site, the first thing they did was pull the operating data:
| Permeate Flow (m³/h) | Concentrate Flow (m³/h) | Feed Water Conductivity (µS/cm) | Permeate Conductivity (µS/cm) | Feed Pressure (MPa) | Inter-Stage Pressure (MPa) | Concentrate Pressure (MPa) | Recovery Rate (%) | Salt Rejection (%) | Water Temp (℃) |
| 23 | 10 | 1100 | 65.7 | 0.9 | 0.83 | 0.7 | 66.7% | 94% | 20 |
The sampling point was at the end of the line, with individual pressure vessel conductivity readings taken from: The last vessel in the first stage The first vessel in the second stage Initial pressure vessel conductivity readings (µS/cm):
| Vessel # | Permeate Conductivity | Vessel # | Permeate Conductivity | Vessel # | Permeate Conductivity |
|---|---|---|---|---|---|
| Stage 1-1 | 12.1 | Stage 1-2 | 12.4 | Stage 1-3 | 11.8 |
| Stage 2-1 | 14.1 | Stage 2-2 | 13.6 | — | — |
Then they disconnected the permeate header to test each vessel individually:Individual pressure vessel conductivity readings (µS/cm):
| Vessel # | Permeate Conductivity | Vessel # | Permeate Conductivity | Vessel # | Permeate Conductivity |
|---|---|---|---|---|---|
| Stage 1-1 | 12.1 | Stage 1-2 | 8.1 | Stage 1-3 | 9.8 |
| Stage 2-1 | 107 | Stage 2-2 | 213 | — | — |
If you look closely at the numbers, you’ll see the main culprit behind the system’s poor salt rejection is the last few membranes in the second stage.
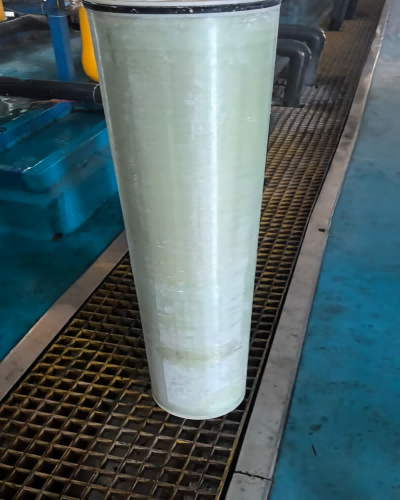
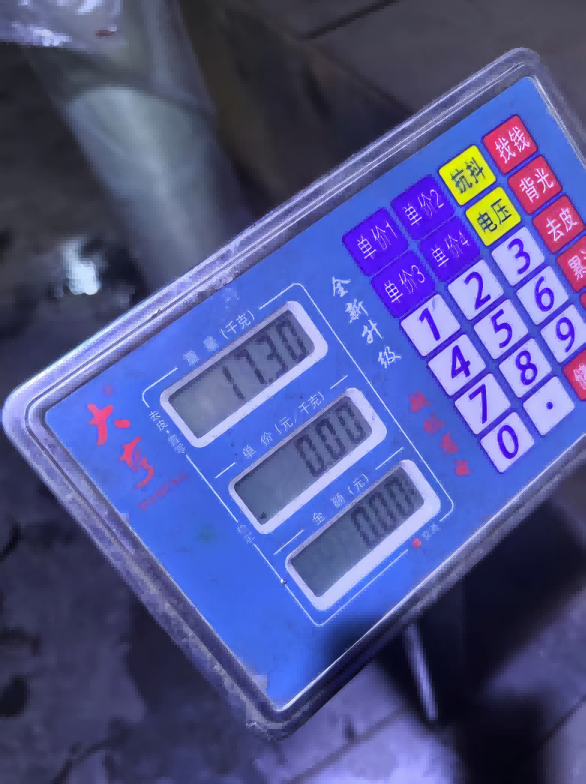
They pulled out the very last membrane from each of the two second-stage vessels, and you could see scale buildup on the surface. After draining the excess water, they weighed them: 17.2 kg and 17.3 kg respectively. For reference, a clean, wet membrane weighs about 14.5 kg. That means each of these had roughly 2.7 kg of scale built up on them!
Think about it—when a membrane gets clogged up like that, a drop in salt rejection is exactly what you’d expect. We walked the customer through a chemical cleaning, focusing on acid cleaning to dissolve the scale. Once that was done, the system’s salt rejection bounced right back to its original level!
Alright, that’s it for today’s topic on dropping salt rejection.
At XBYMC, we’re all about building a community where water treatment professionals from around the world can share ideas and troubleshoot together. Drop a comment below—we’d love to hear from you! Catch you next time for another episode of “Why Did You Change?”.